
Donald Trump won back the White House largely because of who turned out to vote, according to new data from Pew Research.
The demographic shifts that have been widely reported from voting analyses are true but must be understood in context, according to the Pew report. “These shifts were largely the result of differences in which voters turned out in the 2020 and 2024 elections. As in the past, a relatively small share of voters switched which party’s candidate they supported.
“In 2024, Trump benefited from higher turnout among those who voted for him in 2020. He also held an edge over (Kamala) Harris among voters who did not vote four years earlier — a group that was considerably more diverse than those who voted in both elections.”
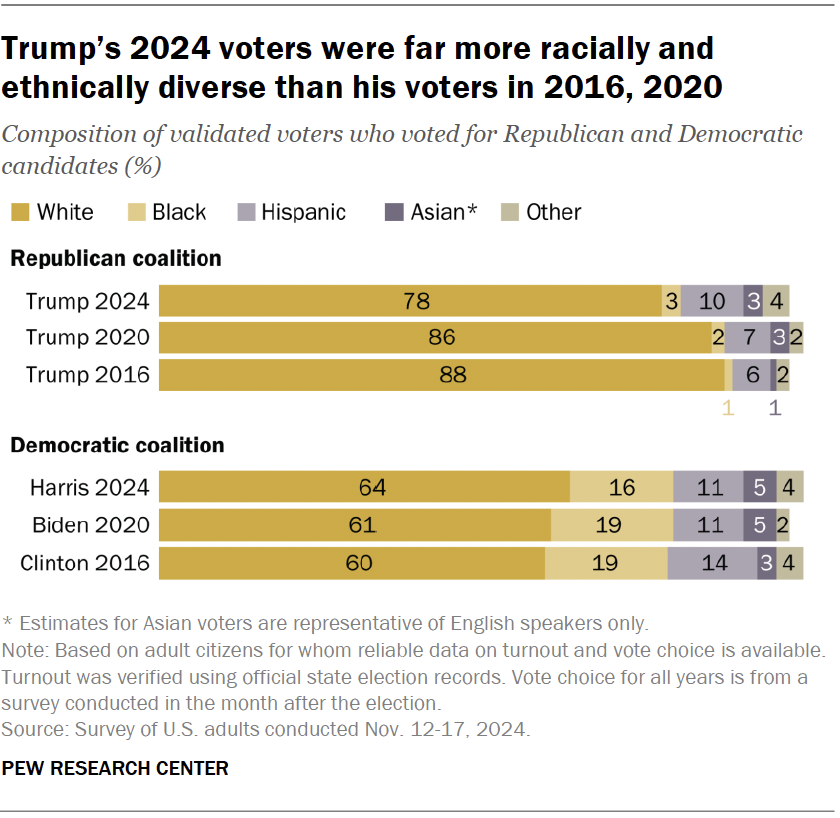
Nationwide, Trump defeated Kamala Harris by 1.5 percentage points, winning 312 Electoral College votes and the national popular vote for the first time. His voter coalition was more racially and ethnically diverse than in 2020 or 2016, according to the Pew analysis.
- Among Hispanic voters, Trump battled to near parity in 2024 (51% Harris, 48% Trump) after losing to Joe Biden 61% to 36% in 2020
- Trump won 15% of Black voters — up from 8% four years earlier.
- While a majority of Asian voters (57%) backed Harris, 40% supported Trump, creating a narrower margin than Biden’s in 2020 (70% to 30%)
Trump’s 2024 victory also was driven by “the demographic patterns in voting preferences that have dominated American politics for the last several decades,” according to Pew:
- Educational divide. “In each of his campaigns, Trump has held an edge among voters without four-year college degrees. But his 14-point advantage among noncollege voters (56% to 42%) was double his margin in 2016. Harris won voters with college degrees by 57% to 41%, but that was smaller than Biden’s lead among this group in 2020.”
- A wider urban-rural gap. “Trump won voters living in rural areas by 40 points (69%-29%), which was higher than his margins in 2020 or 2016. Harris’ advantage among voters living in urban areas was nearly as large (65% voted for Harris, 33% Trump).”
- Religious attendance. “Nearly two-thirds of voters who attend religious services monthly or more (64%) voted for Trump, while only about a third (34%) supported Harris. Harris held a narrower advantage (56%-43%) among the larger group of voters who attend services less frequently.”
The Pew analysis is based on a postelection survey of U.S. adults conducted Nov. 12-17, 2024, on the American Trends Panel, which is a longitudinal study. This allows Pew to examine how individuals changed their turnout or candidate preferences over time.
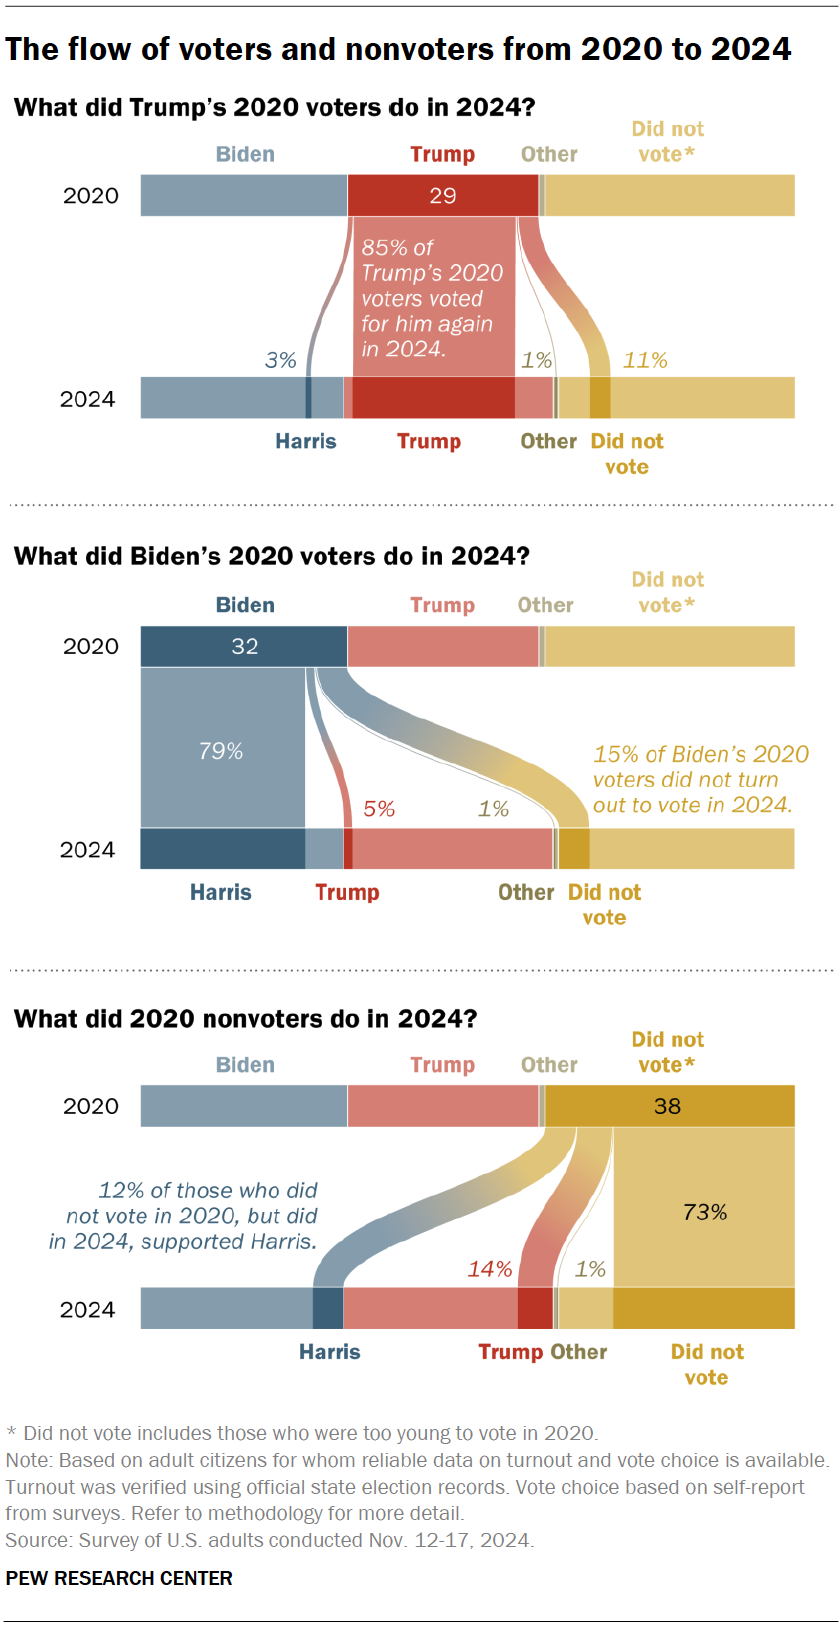
The report explains: “While most of those who voted in 2020 cast ballots again in 2024, a larger share of Trump’s voters (89%) than Biden’s (85%) turned out. And a larger share of those who did not turn out in 2020 — but did in 2024 — supported Trump (54%) than Harris (42%).”
 Other key points:
- Between 2020 and 2024, 85% of those who backed Trump in 2020 did so again in 2024. About one-in-ten of Trump’s 2020 voters (11%) didn’t turn out in 2024, and 4% voted for Harris or someone else.
- Harris received 79% of Biden’s 2020 voters. Compared with Trump’s 2020 voters, a larger share of Biden’s didn’t vote in 2024 (15%), and 6% voted for Trump or another candidate.
- Most adults who were eligible to vote in 2020 — but declined to do so — stayed home again in 2024. But among those who did turn out, Trump had the edge. Among all 2020 nonvoters (including those who were too young and ineligible to vote in 2020), 14% supported Trump in 2024 while 12% supported Harris.
- About three-quarters of eligible adults did the same thing in 2024 as they did in 2020: voted for a candidate of the same party or did not turn out.
- About a quarter of eligible adults did something different in 2024 than in 2020: They switched their vote choice, voted in 2024 when they had not voted in 2020, or did not vote in 2024 after voting in 2020.
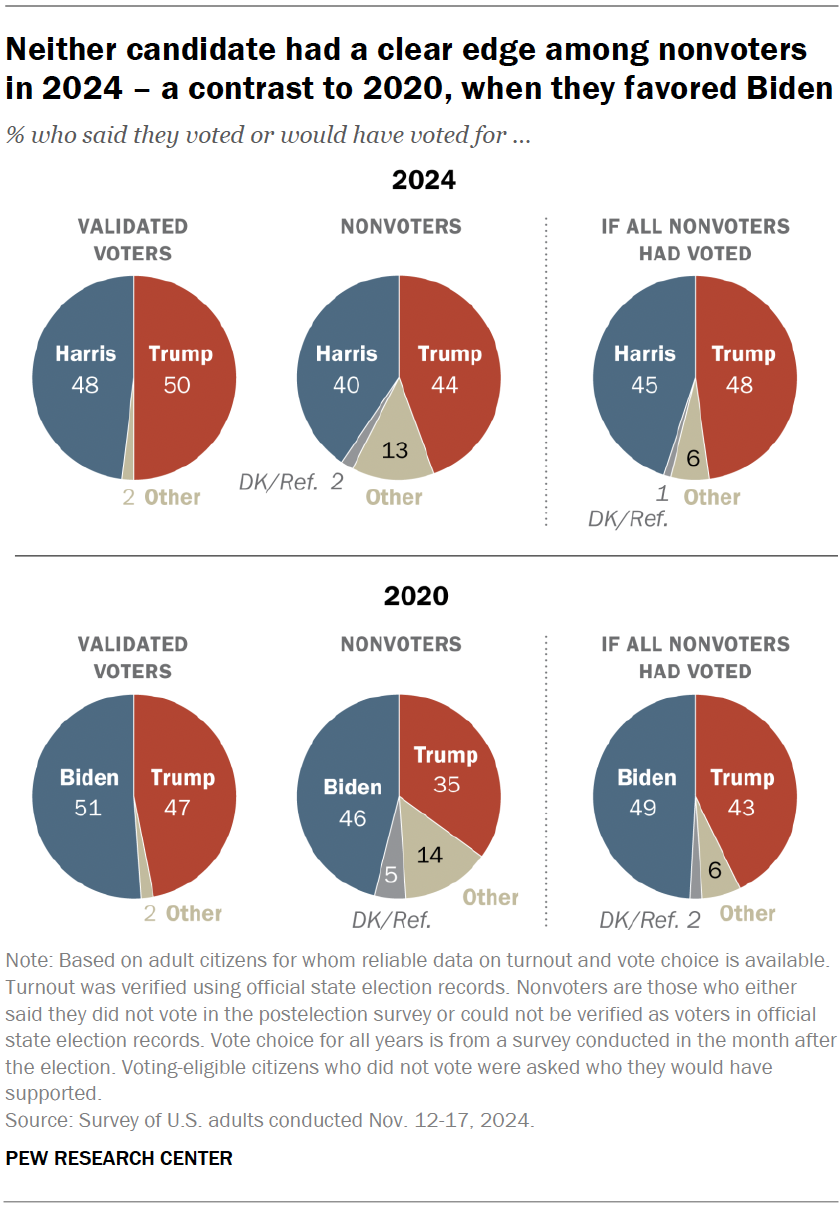
The Pew report comes to this important conclusion: “Harris would not necessarily have benefited from higher voter turnout.”
The reason? “When asked how they would have voted, people eligible to vote who did not do so were fairly evenly split in their preferences: 44% said they would have supported Trump, while 40% said they would have backed Harris. This is a stark contrast to 2020, when those who didn’t vote expressed a clear preference for Biden over Trump (46% to 35%). Democrats have held an edge among nonvoters in prior elections dating back to at least the 1960s — though there is some evidence this advantage had declined in recent elections.
“As a result, if all Americans eligible to vote in 2024 had cast ballots, the overall margin in the popular vote likely would not have been much different. In contrast, if all eligible Americans had voted in 2020, Biden’s margin of victory would likely have increased.”